Blog
April 2025 Market Update: High and Dry

Last night, we hosted our Spring Market Update dinner at Del Frisco’s Steakhouse titled “Winning Strategies to Protect Your Portfolio in Uncertain Times.” To all of you who were able to attend and participate in this topical discussion, we thank you. For those of you whom could not join us, we wanted to provide a summary of some of the key points and charts we shared.
Performance Scorecard
This year has certainly been a whirlwind in geopolitical headlines, and thus stock market performance. As of yesterday, the S&P 500 is down approximately -15% year-to-date and the tech heavy NASDAQ is down approximately -17.5%. The average bond is down around -1% as interest rates have recently started to reaccelerate higher (causing bond prices to go down). When both stocks and bonds decline together, it can certainly be a tough market to navigate. As many of you know, we generally shy away from bonds (as we believe there is a lot of risk in owning them, particularly when inflation is still an issue), and instead, have favored both gold and alternative investments, namely managed futures, both of which have been a bright spot in this otherwise tough environment. Gold has continued last year’s strong performance returning approximately 18% year-to-date, while managed futures are slightly positive on the year. So, what is going on?
A Walk Down Memory Lane, Fed-Style
Before discussing some of the ‘here-and-now,’ we think it is apt to take a step back and reflect on where the country and economy has been the last couple of decades. In the last 25 years, the stock market has experienced three notable declines. First, was the Tech Bubble in 2000. Here, the Federal Reserve Chairman at the time, Allan Greenspan, cut interest rates to stimulate the economy and the federal government started to spend more money than it took in from taxes (ie running a budget deficit). While government spending is notoriously inefficient, it is spending nonetheless, and it does provide a boost to the economy. 2001 was the last year the federal government ran a balanced budget (ie a budget surplus). Second, was the Housing Bubble/ Great Financial Crisis, which was in large part, caused by the ‘fix’ to the prior crisis. Here, Ben Bernanke at the Federal Reserve responded by cutting interest rates to zero and performed three rounds of “Quantitative Easing,” or effectively, printing money to buy bonds in the market which also in turn artificially suppresses interest rates. The federal government also responded by bailing out the banks (recall TARP, the Troubled Asset Relief Program). Third, was the COVID crash where the stock market declined precipitously by over 30% in three weeks. Can you guess what the ‘fix’ was this time? If you guessed more interest rate cuts, money printing to buy bonds, and government spending (this time through direct stimulus checks), then you guessed right.
So, while these responses may have pushed us through each crisis at the time, what was the long-term result: $37 Trillion in national debt with $160 Trillion in unfunded liabilities (Medicare/Medicaid, Social Security, and unfunded pensions), the highest inflation rates since the 1970s, and out of control government spending (annual deficits that add to the national debt). A rather dire picture for the nation.
Tariff Tantrum Time
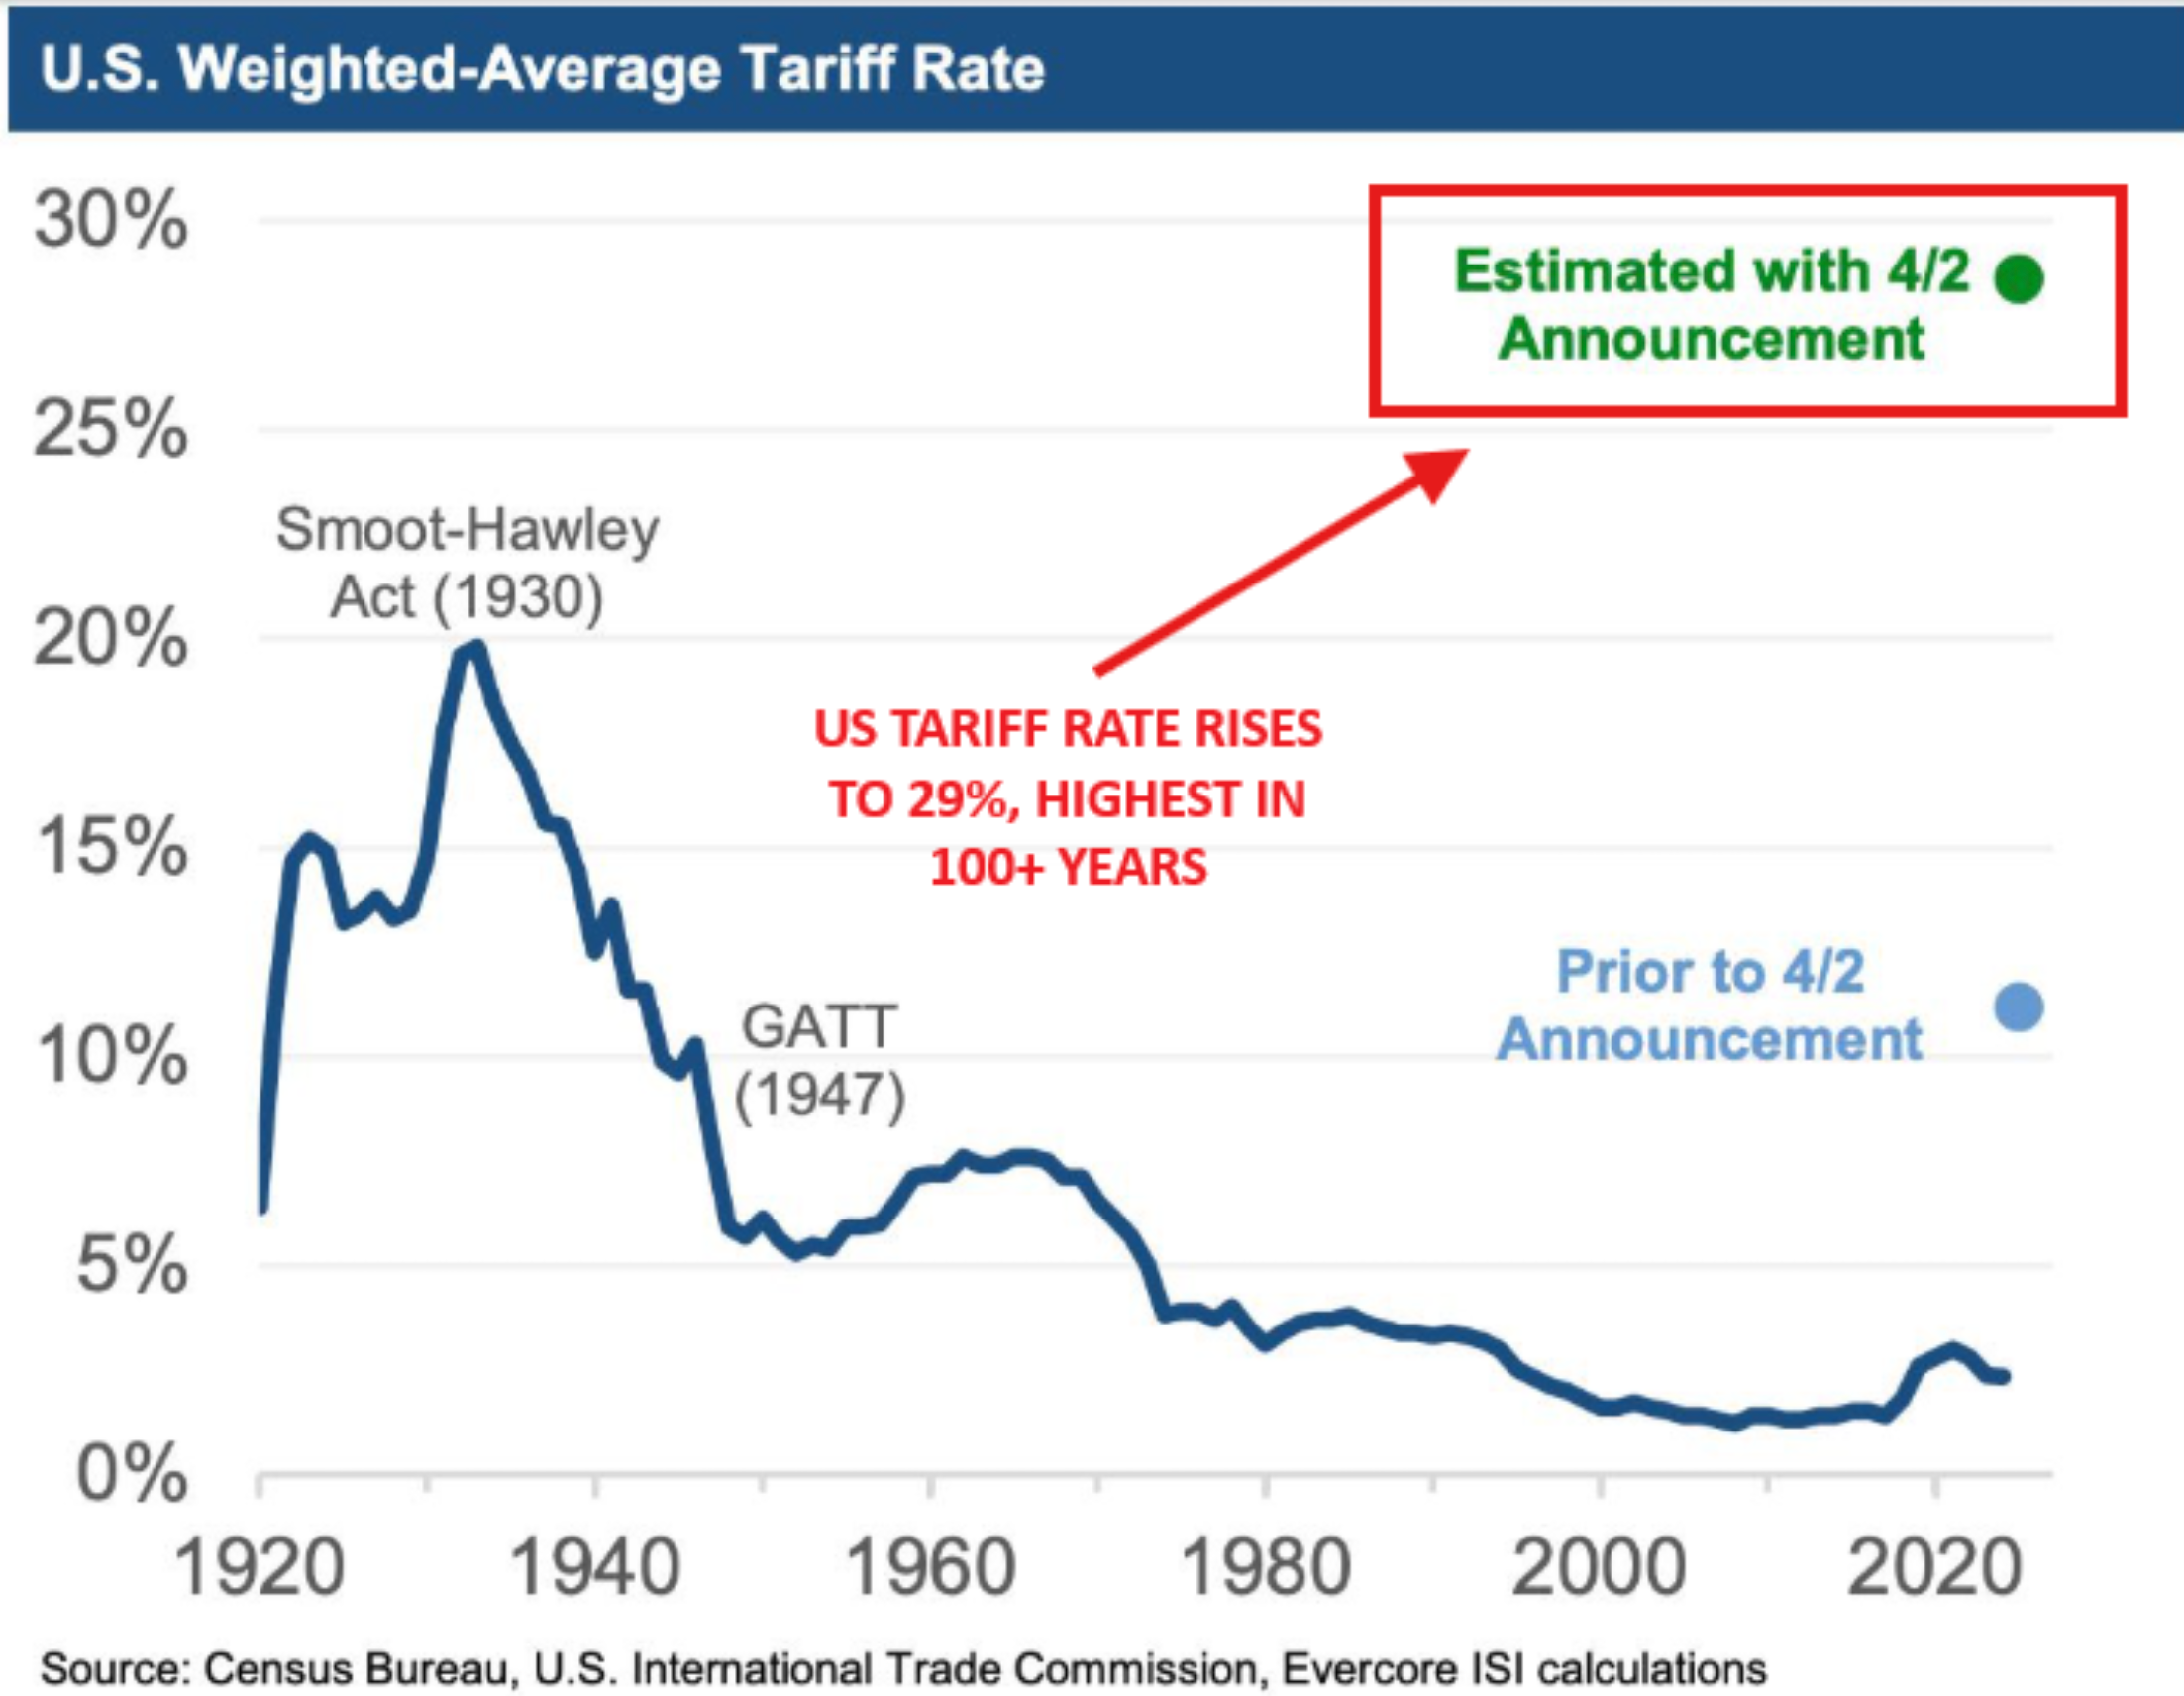
This brings us to today. While we are not endorsing or taking any sides politically, tariffs are one possible answer to increasing government revenue, thereby closing the deficit. To put the tariff situation in historical context we refer to the chart below shared by the Kobeissi Letter. Prior to the April 2nd “Liberation Day,” it was estimated that President Trump would impose around a 10% tariff across the board. The market was certainly wavering leading up to this. After the April 2nd announcement, the tariff rate came in notably higher than the previous estimates and higher than the protectionist Smoot-Hawley tariffs of 1930. The stock market reacted by dramatically selling off over 10% in just a couple of days.
A Bull Market in Fear
This sell-off, we argued last night, is overdone, at least in the short term. While predicting the news is a futile effort, we can get a sense of market sentiment and positioning. Many of you know we like to use the CNN Fear & Greed Index as a key component to estimating this. As of this morning, the index was a 4 (out of 100), falling in the extreme fear category. For context, during the COVID market bottom it was approximately 1. This tells us that much of the selling has been done, for now, and that any incrementally positive news sets up for much upside.

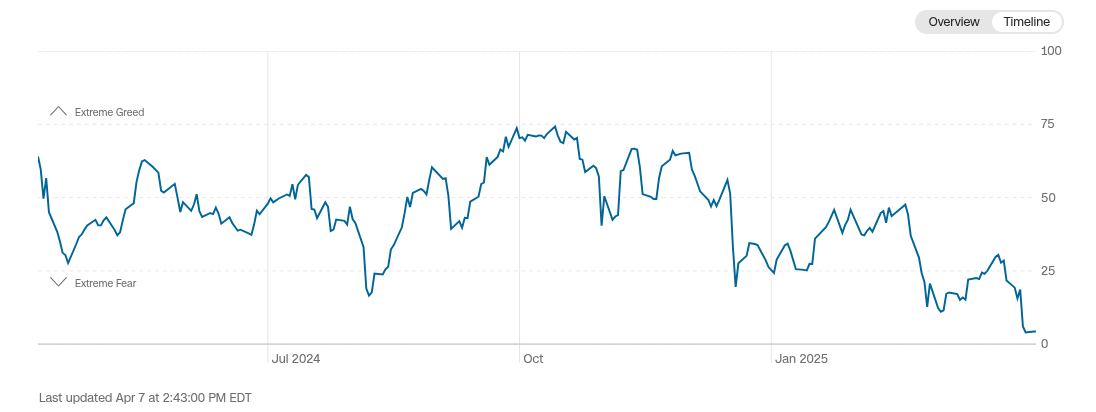
Alas, as of this Wednesday afternoon, President Trump announced a 90-day pause in the tariffs (ex-China) sparking a nearly 10% stock market rally in just one day; the best single day in the stock market in 17 years. Again, while we cannot predict the news, the Fear & Greed Index gave us a hint that most of the selling should have been complete.
Overall, we are positive on the markets here, if for no other reason than too many investors fell in love with cash and being conservative when the odds favored just the opposite. In a sense, they were left high and dry today.