Blog
June Market Update: Opportunities in a Wild Market

If you turned off all your screens and went on a 3 to 4 month vacation and finally checked on how the stock market was doing this year, you would see the S&P 500 up approximately +1.5% year-to-date. You probably would have thought, “okay, I guess not too much has been going on.” Well, how wrong that assumption would have been, at least from a volatility point of view. While it is true the S&P 500 suffered a nearly -20% peak to trough decline, it now sits just 3% away from the February 19th all-time high. So, while the drawdown was measurable – and the headlines scarier – had you paid no attention, this would seem like any other year.
This dynamic nearly perfectly encapsulates Warren Buffet’s outlook on owning stocks for the long-term. In April of this year, he told CNBC, “some people should not own stocks at all because they just get too upset with price fluctuations. If you’re going to do dumb things because a stock goes down, you shouldn’t own a stock at all.” We would agree with this sentiment.
That said, risk management is still paramount when things become increasingly unclear. Specifically, the S&P 500 precipitously declined over -12% in less than a week upon President Trump’s “Liberation Day” tariff announcement where he proposed the highest tariffs since the protectionist Smoot-Hawley tariffs of the Great Depression. The market expected a 10% across the board tariff and instead a nearly 30% tariff was announced (higher than the 20% tariffs of the 1930s). Here, the market was unable to ‘handicap’ the ramifications of this announcement and the ‘shock’ caused a ‘capitulation event,’ in finance parlance. Of course, in real time, we did not know for certain it was in fact capitulatory selling, but our metrics informed us this was the case. The news kept getting worse, but the market was in fact oversold, which we wrote about extensively in our April Update. We used this opportunity to put a significant amount of cash to work and take advantage of the lopsided positioning in the market.
TACO
Since then, the stock market has nearly recouped all its losses. The TACO (Trump Always Chickens Out) Trade prevailed. Today, current tariffs in place are approximately 14-15%, half of what was initially announced. In true Trump fashion, he went hard to one extreme and then walked back most of it. Should he have done this to begin with? Was the whole thing pointless? Maybe. Probably. But, we do not really care or have too much opinion; it is our job to manage investments only and take advantage of market mis-positioning. This would have been impossible if we were caught up in the news, politics and emotion of it all. This is why we always say, “we don’t time the market.” Timing the market means you sell at the high. How would you know to do this? You could be right, or you could have sold for a reason that does not matter only to see the market make new highs. Instead, we will react to the playing field, if needed, and based on our various metrics.
Onward
So where do we go from here? As of now, it is business as usual. The stock market is up a little less than +1% so far in June. It has been digesting this massive rally off the April lows and is basically flat the last two or so weeks; this price action does not surprise us. One of our preferred metrics is CNN’s Fear & Greed Index. Today, it sits at 55 in ‘Neutral” territory (after bottoming at an Extreme Fear reading of 3 and peaking at a Greed reading of 70 a month ago). In the short-term, we expect more chop and range bound trading. The longer the market trades sideways – all else equal – the more the market has ‘cooled off’ and can resume higher, which is our base case.
There’s Always a Problem
Of course, now we have a new problem, the Israel-Iran conflict and our yet to be determined involvement. Historically, they have launched missiles at each other off and on, and while it creates volatility, it has been short lived and passes. While we are sure the Israelis are very scared, and rightly so, how dramatic has their stock market been thus far? Since June 1st, the Tel Aviv Stock Market is up almost +7%. Up, not down. Again, the fear and news do not necessarily dictate investment reaction, and in this case, quite the opposite. Is there a bull case here? Yes, either that it remains a small tit-for-tat skirmish with little to no US involvement, or even swift coordinated US airstrikes that leave the Iranian government completely immobilized (which Israel has already succeeded to some degree here). Should the US get highly involved, particularly on the ground, this would suggest a more protracted conflict that would likely send crude oil materially higher and re-stoke inflation crushing any hopes for Fed rate cuts. In this scenario and/ or if the Fear & Greed Index began to drop sharply, you could expect us to reduce risk in the portfolio. Similar to the trade hullabaloo, we hope cooler heads prevail.
Let’s also briefly review a few other topics below.
US Fiscal Situation
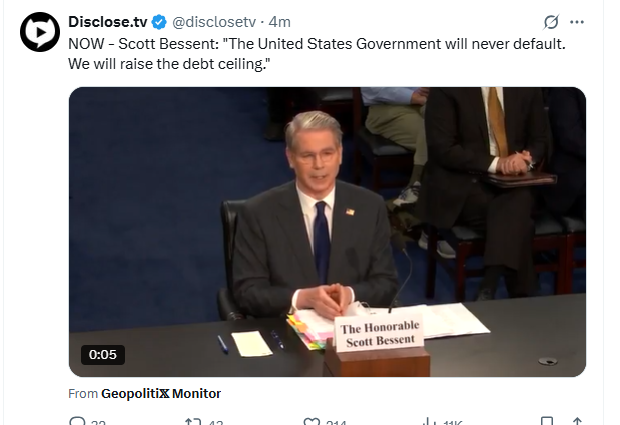
The US national debt just surpassed $37 Trillion for the first time yesterday. Despite the hoopla around DOGE, the deficit (more annual spending than revenue) continues to widen. Elon Musk claimed he was cutting $1 Trillion, but current estimates suggest cuts of maybe $10-20 Billion per year for the next 10 years (so approximately 1/10th the stated goal). As we wrote about in our fall update regarding the fiscal situation, there is just not much room to cut. Approximately 2/3rds of the annual budget are Entitlements (Social Security, Medicare, and Medicaid). As we know, there is no political will for cuts here, so this is mandatory spending, or substantially all. The defense budget is close to $1 Trillion (of the approximately $7 Trillion budget). This is likely not going down, so this might as well be mandatory spending. And interest on the debt is also close to $1 Trillion, which is mandatory unless we default. And our Treasury Security (and all his predecessors) continue to believe we will never default as they will just take on more debt (and the Federal Reserve will print and buy it). If you were doing the math, that’s approximately 90% of the budget that is mandatory spending. In 2025, the deficit has widened by approximately $200 Billion thus far and the betting markets are assuming it will widen by $400 Billion for the full year. We agree.
Treasuries & Precious Metals
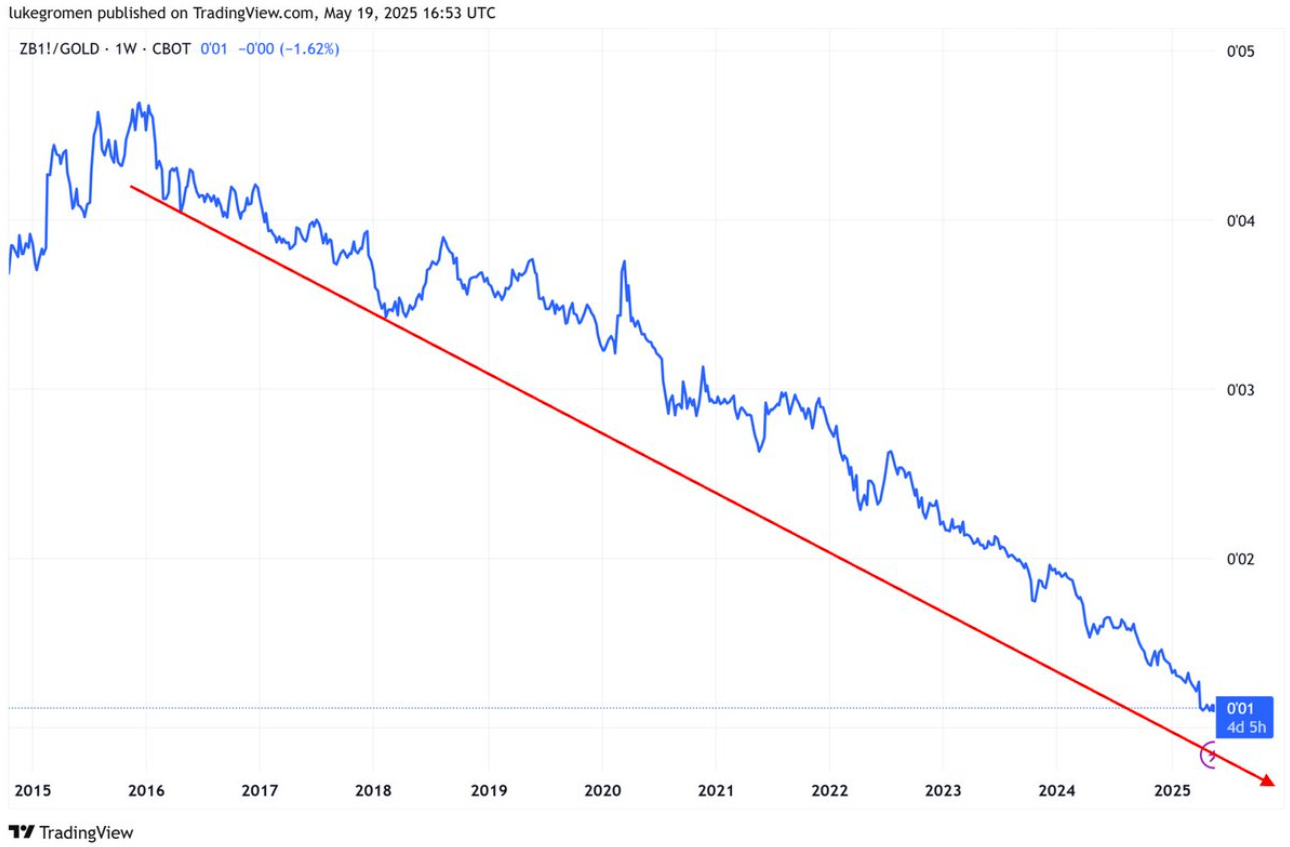
So, what does all this mean? It continues to be constructive for stocks, precious metals, and bitcoin, at the expense of US Treasuries. See the chart below shared by macro-economist Luke Gromen. Since approximately 2015, global central banks have on net been sellers of US Treasuries. The chart shows Treasuries priced in Gold, so Treasury prices are the numerator and Gold price is the denominator. US interest rates have more than doubled in the last decade due to inflation and credit risk, and when interest rates go up, bond prices go down. Gold by contrast has been the net winner as it has appreciated almost 3x in the last decade due to the aforementioned fiscal and currency dynamics. As of last week, gold surpassed the Euro as the second most held asset behind the US dollar amongst global central banks. We predict central banks continue to accumulate gold at the expense of fiat currencies and thus continue to like our precious metal positioning.
Bitcoin
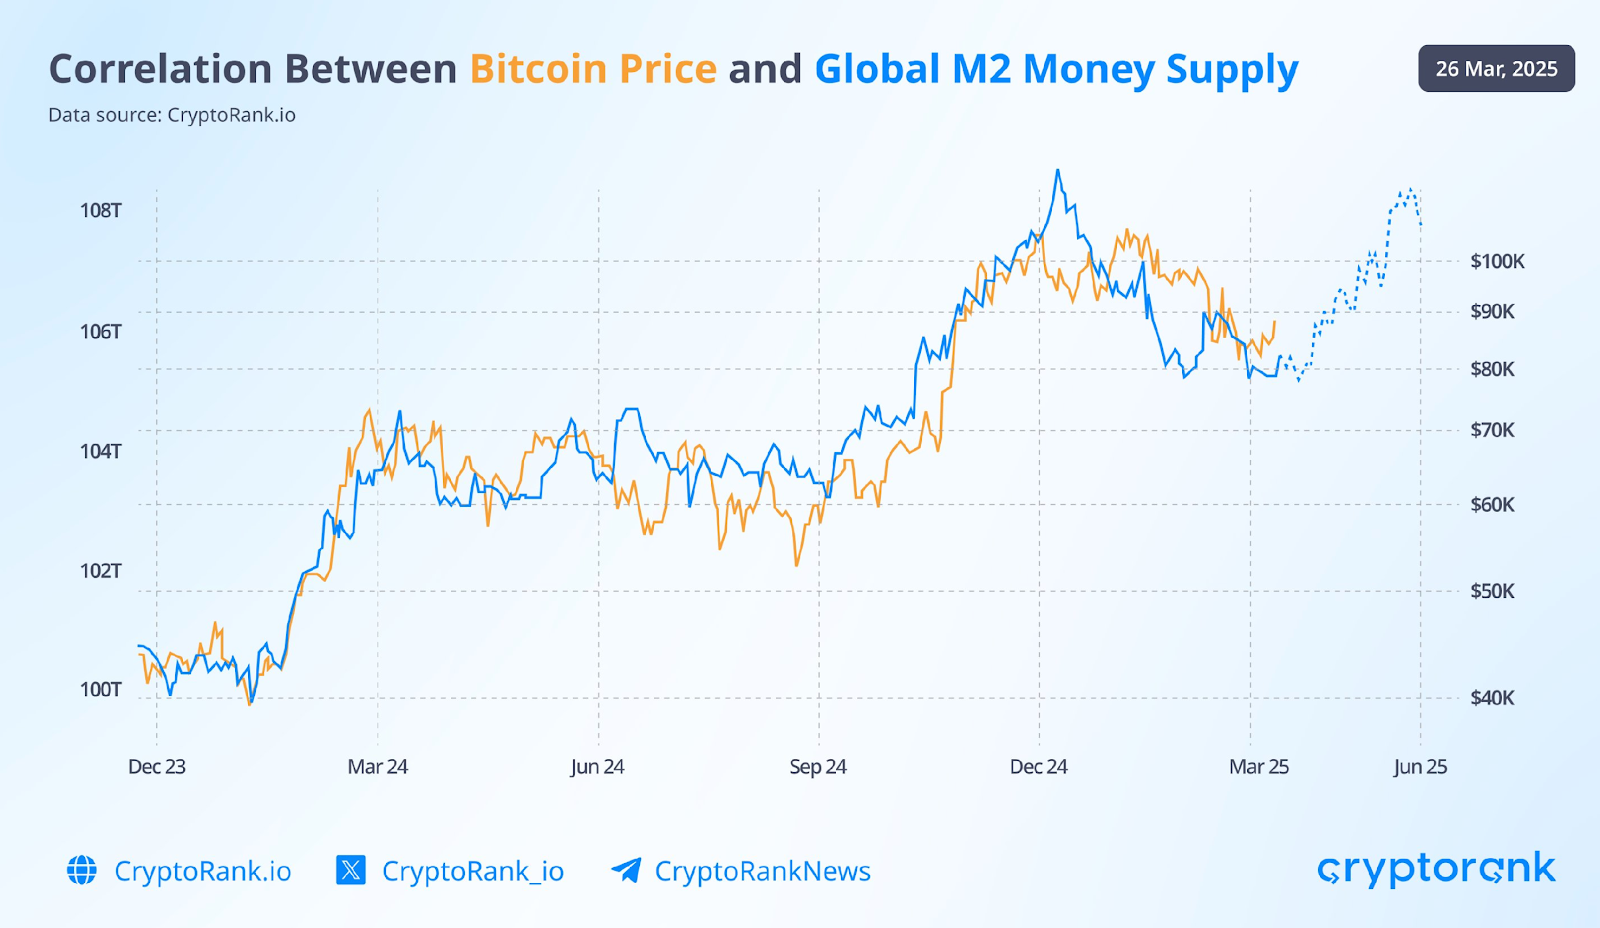
Whether or not bitcoin is truly ‘digital gold’ is still subject to debate. It still correlates with tech stocks, oftentimes does not go up when gold goes up, nor does it have the history and even physical utility of gold. However, it does tightly correlate with Global M2 Money Supply. M2 Money Supply includes cash, checking and savings deposits, money market accounts, and other smaller deposits globally. So when global central banks are easing, either through cutting rates or buying their own bonds or both, Global M2 Money Supply expands. Said another way, when global central banks ease, more money is created. This money has to go somewhere, and some it gets allocated to bitcoin as a hedge on inflation and money printing. Currently, there are at least 10 central banks globally that are easing or expanding their money supply, hence global money supply is increasing. The chart below from March suggests the price of bitcoin will follow this continuation in global money supply. Fast forward three months later and bitcoin has rallied from $80,000 to over $100,000. This is why we allocated a piece of portfolios to an ETF that tracks the price of bitcoin. We expect global money supply will continue to expand and just imagine what will happen once the Fed finally joins the rate cutting party. The wild card here is that bitcoin tends to go down in broad sell-offs and macro-events (i.e. Iran goes bad case scenario). If so, you can expect us to reduce or eliminate the bitcoin position for the time being.