Blog
Late Summer Market Update: Pick Your Poison

A Sentiment Driven Market
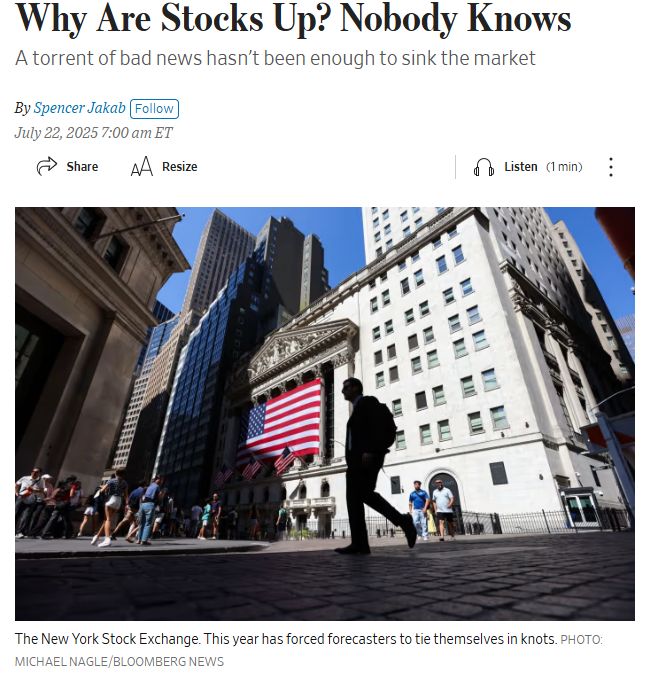
Is this a positive environment, or a negative one for the markets? It really depends on who you want to believe. In a sense, this is a ‘pick your poison’ market; the outlook depends on what factors you choose to pay attention to. Long time clients of ours know of our aversion to letting the news dictate our investment decisions. Case in point, see the below article from July in the Wall Street Journal, “Why Are Stocks Up? Nobody Knows. A torrent of bad news hasn’t been enough to sink the market.”
While the news could have an impact on the market in the short term, we contend that sentiment and positioning primarily drive market trends. In fact, the market can move higher in spite of negative news, which is just what we have seen since July as the S&P 500 has marched on almost 3% and sits 8% higher since the start of the year.
Over the last couple of weeks, negative headlines have surrounded the weakening job market, which are objectively true, and yet, the market has barely batted an eye. Why? Well, sometimes, the market interprets ‘bad news is good news.’ This is because when economic data comes in weak, the market uses this as rationale for Jay Powell and the Federal Reserve to cut interest rates in the future, which is simulative for most assets. So again, even real negative news had the opposite effect on the stock market. This is a fairly well known phenomenon at this point, yet market participants still get caught up in the negative data points in real time and make hasty decisions.
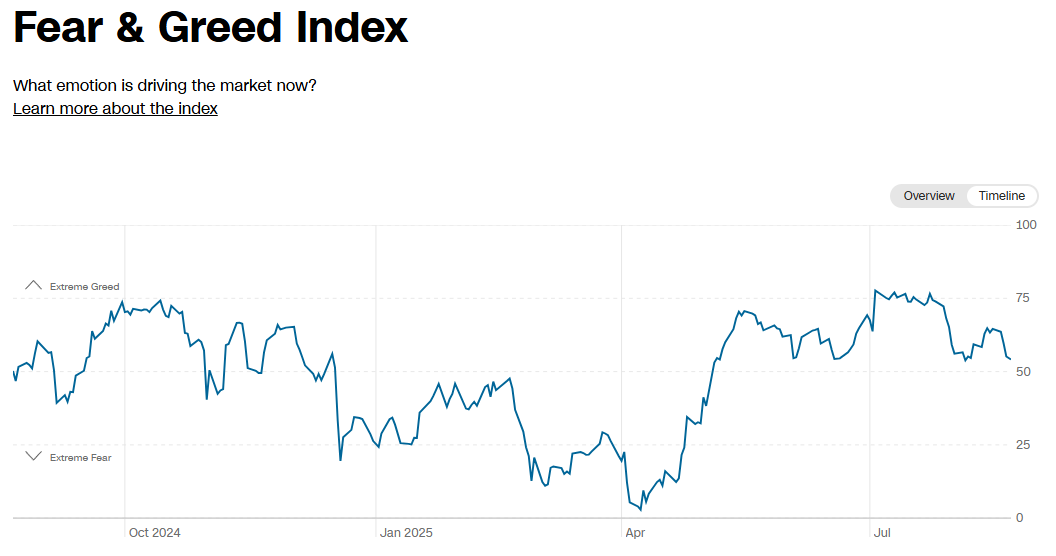
Instead, we rely on a handful of indicators such as CNN’s Fear & Greed Index, which plots statistical data around sentiment and positioning and informs us how much risk or reward exists at any given time. While the stock market is about 1% off a new all-time high, this indicator is currently sitting at a 55 out of 100 reading, informing us there is still plenty of room for the market to move higher as part of this ongoing rally.
Let’s review a couple of recent headline developments below.
Tariff Update
Of course, the specter of tariffs have been driving the headlines all year. We know that since President Trump announced a 90-day pause on tariffs with China on April 9th, the stock market subsequently rallied 30%, the fastest recovery back to a record high in history (at which time CNN’s Fear & Greed Index was at a multi-year low of 3 out of 100 on April 8th). Last Monday, President Trump extended the tariff truce for yet another 90 days. Interestingly, the S&P 500 has traded flat since. This is an important dynamic to highlight: the market has (almost) entirely moved on from tariff headlines. This is not unprecedented but rather a common occurrence in stock market investing. Once something has moved the market so dramatically over a period of time, it has been ‘digested’ and the market is largely desensitized to it. The Federal Reserve’s potential rate cuts for the remainder of the year are now the primary focus of the market, which we will address shortly. So where are we with tariffs?
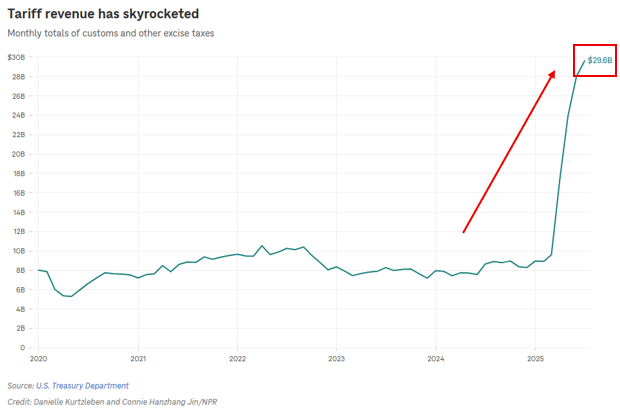
Currently, the trade-weighted average tariff rate the US has imposed on the world sits at approximately 20%. In true Trump fashion, this sits squarely in the middle of where the stock market assumed Trump to be before Liberation Day (10%) and the 30% he threatened on Liberation Day. In dollar terms, the Treasury has brought in almost $30B of tariff related revenue in July, up from just $8B in March when it began. Annualized, this is over $300B of new revenue per year. To put this in perspective, all of corporate income taxes last year were about $370B. So, certainly a very material amount of new revenue for the government. The TACO (Trump Always Chickens Out) Trade has proven to not be entirely true.
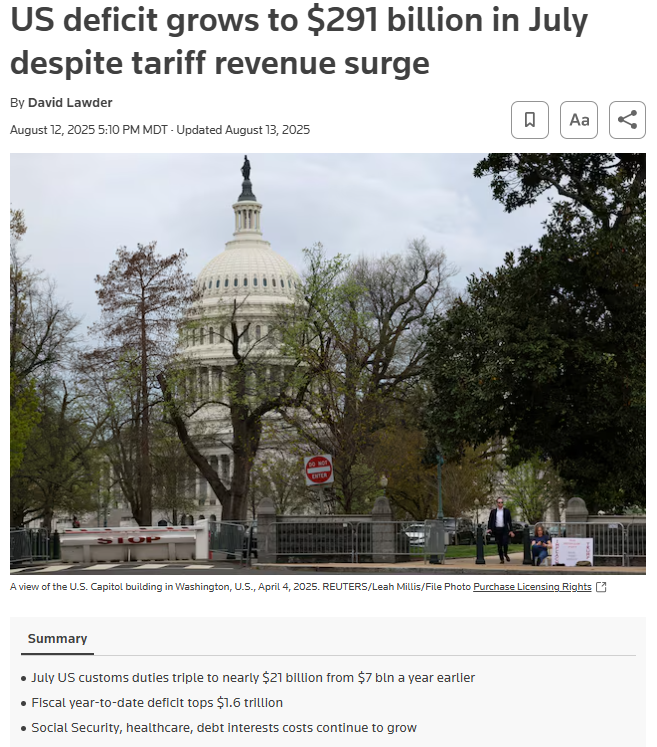
All else equal, this would be a good thing for the disastrous US fiscal situation. Problem is, all else is not equal, as the deficit (how much more the government is spending versus bringing in) was up 20% in July to $291B. Meaning, despite the $30B in tariff revenue in July, the US Government still spent $291B more than it brought in through all forms of taxes. As Reuters aptly notes below – and we have repeatedly written about – Social Security, healthcare, and debt interest costs continue to grow and vastly outpace any incremental tariff revenue. As such, the US national debt recently crossed $37 Trillion for the first time. We have a spending problem, not a revenue/tax problem. This continues to be constructive for stocks, precious metals, and cryptocurrencies, at the expense of the Dollar and Treasuries.
Inflation Update
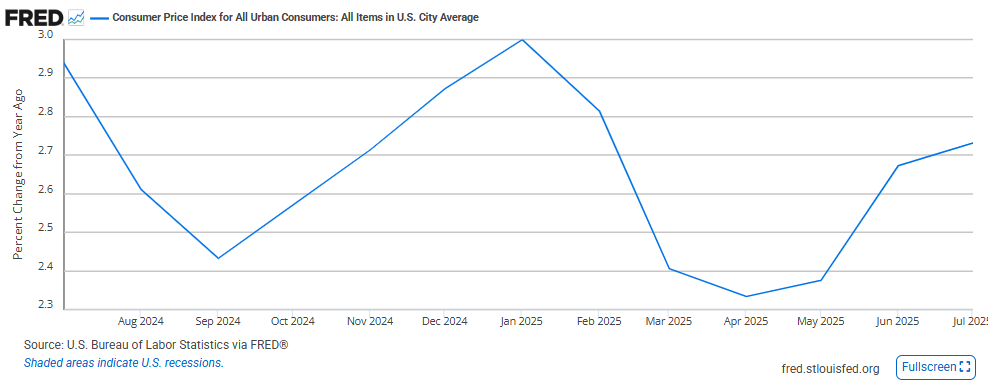
Last Tuesday, the CPI (Consumer Price Index), the most commonly cited measure of inflation, grew +2.7% year-over-year in July. While this matched Street expectations, inflation, as measured by CPI, is reaccelerating again from April’s +2.3% growth rate. While tariffs would be the intuitive explanation for this, the primary components driving this index higher for the month were shelter followed by eating away from home, both little-to-not impacted by tariffs. Furniture, of which 2/3rds are imported, is up in each of the last two months.
So, inflation is likely being driven both by tariffs and other non-tariff related dynamics. Likely, inflation will continue to march somewhat higher as companies continue to pass more of these price increases off to consumers. Still, you can see in the chart below by the St. Louis Fed that inflation similarly bottomed in September of last year at +2.45% before reaccelerating to +3.0% in January. During this period of reaccelerating inflation, the S&P 500 rallied 11% to new all-time highs. So, what is the implication here? The jury is still out, although this accelerating inflation is likely the culprit of the last few day’s stock market weakness as this makes it harder for Jay Powell to justify future rate cuts.
What’s Next?
At the end of the week, Jay Powell and the Federal Reserve are hosting their annual Jackson Hole symposium where they will release their much anticipated commentary on the direction of interest rates. The aforementioned topics – tariffs and inflation – will drive their analysis and commentary. Currently, the market is pricing in around 2-3 quarter-point interest rate cuts by year-end. From an inflation point of view, they should not signal future cuts as this will further stoke the reacceleration of inflation. From an economic point of view, they should not signal future cuts as the economy, as a whole, is – and has been – neutral to expansionary in the last two months. As a subset of the broader economy, employment data has been quite weak, which they overweight in their analysis; and therefore, they should signal future cuts. From a ‘Fiscal Dominance’ point of view, aka they need lower rates to finance the ever increasing national debt, they should signal future cuts. Hence the dilemma.
As the Wall Street Journal article we cited at the beginning of this commentary states, “this year has forced forecasters to tie themselves in knots,” and we do not expect to join them now. Forecasting the Fed’s analysis we outlined above is a futile effort, at best. You could be right and have happened to ‘time the market,’ or you could be completely wrong and give up material returns. Instead, we will analyze these dynamics for what they are, hear the Fed’s response, and most importantly, analyze how our indicators react. If, for example, we see the Fear & Greed Index drop below approximately 50 on a negative Fed reaction, you can very likely expect us to quickly cut significant stock exposure. If the response is met positively, or with mild pullback, we will be thankful to have not overreacted to the news.

