Blog
Market Update October 2024: Shine On

If you were only listening to the talking heads on CNBC, you probably would have missed one of the biggest stories of the year – gold’s relentless +30% move higher to an all-time high of almost $2,700/ ounce. In fact, gold has outperformed stocks this year faring approximately 10% better than the S&P 500 and 13% better than the Nasdaq. It has also dwarfed the average bond’s measly +2% return (you actually lost purchasing power in bonds this year as the inflation rate is running higher than the bond’s return).
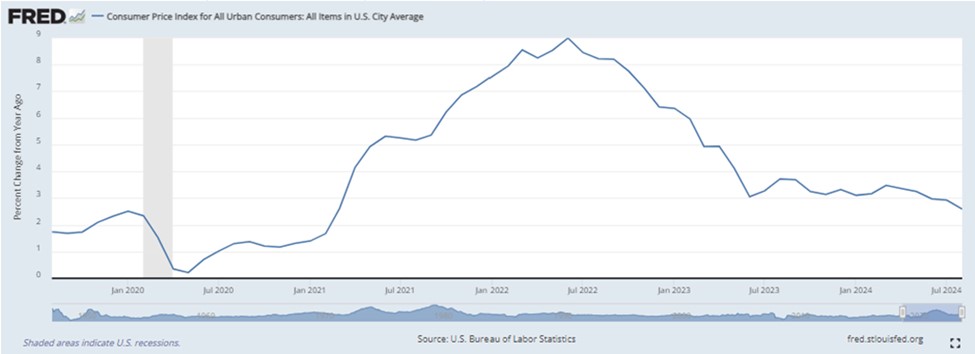
Typically, we hear that gold is an ‘inflation hedge’ and thus performs well in periods of rising inflation. What is interesting is that inflation, as measured by the Consumer Price Index (CPI), peaked at +9% growth in June 2022 and has steadily fallen to approximately +2.5% growth over the last year or so (see chart below from St. Louis Fed on year-over-year CPI growth). Jay Powell and the Federal Reserve – and the stock market as a whole – celebrated this ‘return to normalcy’ and declared the war on inflation a success. The S&P 500 subsequently rallied 50% off the 2022 lows. Interestingly, if gold were only an inflation hedge, one should have expected gold to decline in price as inflation drastically cooled. Instead, gold also increased 50% since June 2022. So, while gold is certainly an inflation hedge, there must be more to the story.
Enter ‘Fiscal Dominance’
The Cato Institute, a DC think-tank, summarizes this dynamic well, “fiscal dominance occurs when central banks use their monetary powers to support the prices of government securities and to peg interest rates at low levels to reduce the costs of servicing sovereign debt.” In other words, the Fed needs to cut interest rates not because inflation or the economy are cooling, but rather, because the federal government is so indebted that it cannot afford to service the debt at higher interest rates. Let’s review a few charts shared by the Kobeissi Letter which aptly highlight the current predicament.
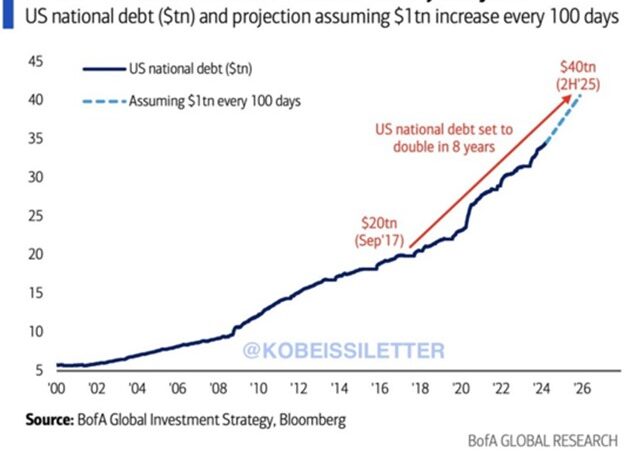
The chart below illustrates the total US national debt, currently at $35 trillion. As you can see, it has been on a torrid advance higher from $20 trillion in 2017 and is projected to double to $40 trillion by next year. Embedded in this projection is that $1 trillion is added every 100 days. We have seen this already occur several times.
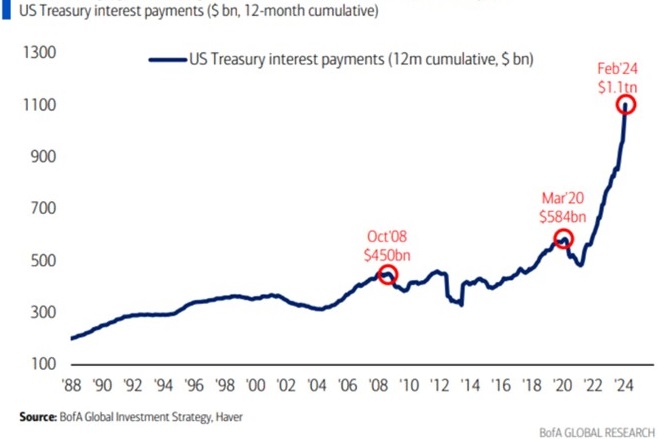
This chart illustrates the surging cost of US government debt. In February of this year, annual interest payments on the debt exceeded $1 trillion for the first time, doubling in just the last four years.
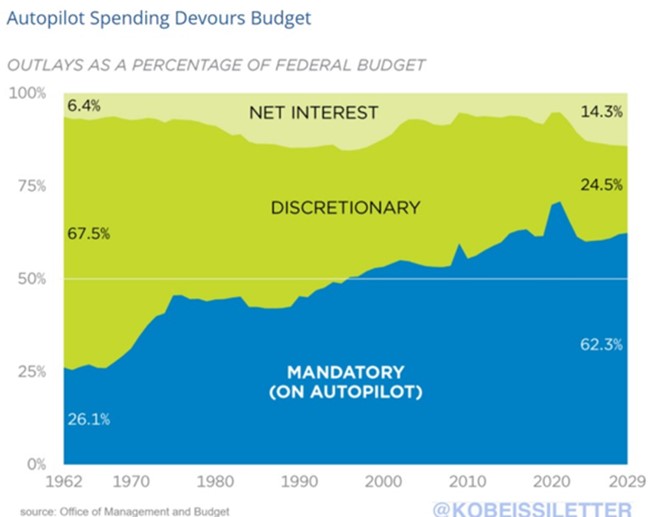
So, can’t the government just decrease spending to decrease the debt? Well, the last time the US ran a budget surplus (i.e. tax revenues were greater than expenditures) was in 2001. In each of the 23 years since then, the US government has run a budget deficit and added more debt annually and at an increasing rate. Moreover, the chart below highlights the glaring problem; there is little to no room to make any material cuts in spending. Entitlements (Social Security, Medicare, and Medicaid) represent approximately 2/3rd of the budget which, by definition, are ‘entitled,’ or mandatory. Interest on the debt is mandatory, unless the government declares bankruptcy, which puts total mandatory spending at 70-80% of the budget.
So what does this all mean?
Fiscal dominance is real and it is here. The government needs lower rates in order to service the ever-growing national debt. That approximately 80% of the budget is mandatory spending and there would appear to be no bipartisan agreement for material discretionary spending cuts or political will for austerity, reveals that the US fiscal crisis has gone acute. Treasury Secretary, Janet Yellen, intervened in Q4 2022 and shifted more issuance of US Treasuries to shorter maturities. This is a tell-tale ‘strategy’ of a sovereign debt crisis as investors shy away from taking additional risk on longer maturity government bonds. More recently, Jay Powell foreshadowed interest rate cuts at the Fed’s annual Jackson Hole Symposium in late August which sent gold another 8% higher. Ultimately, just two weeks ago, he did cut interest rates by half a percent and alluded to the possibility of further cuts.
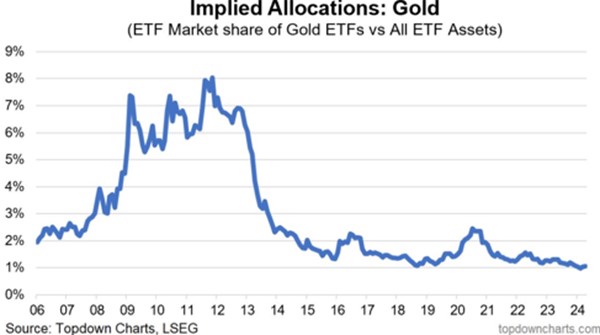
In our view, while parts of the economy are certainly weak, overall, the economy has been neutral to even slightly expansionary and thus should not warrant a rate cut of this magnitude. This supports the idea that fiscal dominance is taking priority in the Fed’s policy making. This has been, and should continue to be, a tailwind for gold and precious metals. Similarly, this has been and should continue to be a tailwind for stocks as investors flee cash and bonds, although other variables will affect stocks at times. For these reasons, we continue to like our long-term gold position, which has been a significant contributor to portfolio performance. If you think gold can’t go up much more, we leave you with the chart below. Based on all the assets in ETFs, investors only have about 1% of their portfolio in gold.