Blog
April 2026 Market Update: A Mirror Image

In last month’s Market Update published on March 25th we wrote:
“The toughest part of investing is handicapping how much of the fundamentals, and future expectations, are currently ‘priced-in,’ or reflected in the market prices. We just outlined a lot of negativity: war with Iran, oil prices up considerably, lagging inflation metrics going up, future inflation expectations going up, and a hawkish Federal Reserve. This is decidedly bearish. As such, we have raised a material amount of cash both from stocks and precious metals. That said, both stock prices and precious metals are down rather significantly. Stocks are just shy of correction territory and precious metals are worse yet, in a bear market. Therefore, a significant amount of this is likely already reflected in the current prices. Of course, the situation could deteriorate further and worsen already weak prices.
Clients of ours know we stress the importance of market sentiment & positioning and our preferred gauge to measure this is CNN’s Fear & Greed Index. Currently, the index is at 17 (out of 100), an Extreme Fear reading. Therefore, this confirms a lot of negativity is already priced in. While we could see this going lower on Iran escalatory news-flow, the next largest move from here is likely higher. We remain cautious yet ready to re-deploy capital.”
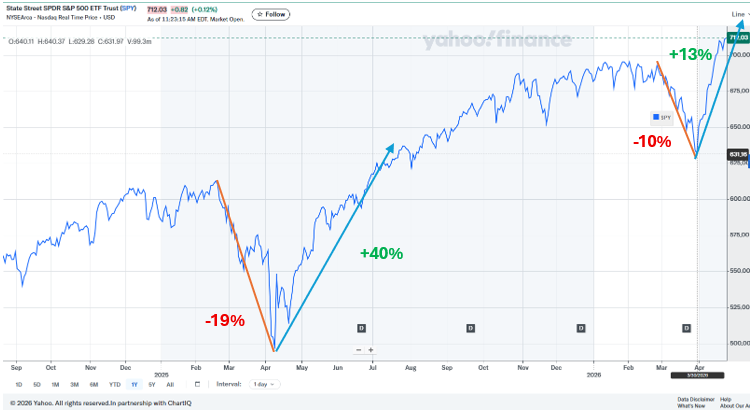
Subsequently, the S&P 500 fell another -4% in the next three trading days; all hope was lost. A large-scale US ground invasion and $200+ oil prices seemed imminent. Then, on March 31st the WSJ reported that the White House was willing to end the military campaign even if the Strait of Hormuz remained partially closed. The bottom was in. The indices went on a record-breaking three-week rally to new all-time highs. The S&P 500’s +13% rally to new highs in just 11 trading days was the fastest recovery in 36 years. The Nasdaq’s +18% rally with a 13-day winning streak was the longest run in 34 years. The semiconductor index (SOX) surpassed even the Nasdaq’s performance with a 16-day winning streak of +40%, the longest in its 32-year history. The speed of this recovery set another ‘V-bottom’ just like last year’s Tariff Tantrum episode (chart below).
In a sense, the first 1/3 of this year is looking like a mirror image of the start of 2025.
Sentiment Trump’s News Flow
As of today, the S&P 500 sits approximately 2% higher than the prior war all-time high. Yet, the war is technically not over, only an extended ceasefire has been announced. Negotiations have stalled, if not failed altogether. The Strait of Hormuz is still functionally closed as the US has imposed a blockade. Crude oil, while down from its $115/ barrel peak three weeks ago, is still 50% higher than its pre-war price of approximately $65. So, how is it possible that we just experienced a record-breaking rally?
Sentiment, not fundamentals, as we continue to discuss. On March 30th, CNN’s Fear & Greed Index, measuring market sentiment & positioning, registered an intra-day low of 8 (out of 100), an Extreme Fear reading, as seen in the chart below. Similarly, we saw two other episodes of a sub-10 Extreme Fear Reading last year. Both registered a market bottom with April’s being most notable. When sentiment and positioning get so skewed to the downside, particularly a Fear & Greed sub-10 reading, it does not take much to ignite a torrid rally. In this case, just the idea that the war could stop and negotiations could take place, regardless if this comes to pass or not, is enough.

A Brief Look at Oil & the Economy
As mentioned, the Strait of Hormuz remains functionally closed with traffic down 95% or so, as seen in the chart below. This has resulted in 500 million barrels of crude being removed from the global market since the beginning of the war in what the International Energy Agency (IEA) calls the ‘largest energy supply disruption in modern history.’ This has caused a barrel of crude to appreciate to around $100/ barrel (and as high as $115 /barrel briefly).

In analyzing the translation of prices of crude to gasoline prices and then adjusting for inflation, Inflationdata.com suggests that the nationwide average gas price was approximately $4.00/ gallon on 3/23/26 (chart below). Since then, crude went up and down and now sits approximately where it was on March 23rd, so today’s implied average gas price is likely still approximately $4.00/ gallon. The implication here is that this is only around 10% higher than the long-term average of $3.61, so this should not be overly burdensome to consumers. Above this level, however, it tends to coincide with business cycle tops of $4.50 to $5.00/ gallon. So, we are basically on the cusp of this being recessionary.

We often cite our preferred measure of economic health being EconPi. Here, it scatterplots several economic data points into a weekly moving composite that does not get skewed by cherry picking any certain economic release. Through last Friday, the last three weeks (April month-to-date), the MoC, or Mean of Coordinates, has been in Decline/ Contraction. Said another way, the economy has been in recession this month, after being in expansion January through March. The takeaway is that higher oil prices have already impacted the consumer and business health. We can see that below with Hires and Consumer Sentiment in ‘off-the-charts’ Contraction. Small Business Optimism and Industrial Production flipped into Decline after being in Expansion in weeks prior.

What We’re Watching Here
This weakening economy is decidedly bearish, unless the market begins pricing in Fed rate cuts to offset this, or a reacceleration in the economy on a reopening of the Strait. Recall, inflation has been running hot again and this was another reason for market weakness in March when the market priced out Fed rate cuts for the rest of the year. It is going to be difficult for the Fed to justify cutting rates with already reaccelerating inflation, so we do not see that happening as of now. This is something we will be monitoring closely.
Lastly, the Fear & Greed Index is currently at 68 (out of 100), or a Greed reading. At this level there is less to glean than at the extremes such as the sub-10 Extreme Fear or an above-90 Extreme Greed level (contrarian signals). Interestingly, despite the record recovery over the last three weeks, the market is not at an Extreme Greed level, which would give us pause that positioning was now maxed out on the bullish side. This is not the case, so the takeaway is that there is still room to run higher, although we could see it pull back in the very short term to cool off while still being intermediate term bullish.