Blog
2026 Mid-Year Market Update: Bring me your Outperformers

First Half 2026 Update
The first half of 2026 has seen extraordinary volatility, both in the large stock indices as well between various asset classes. After an initial peak-to-trough decline of approximately -10% in the S&P 500, attributed primarily to the Iran War, the index rebounded +20% off the lows – one of the sharpest recoveries in stock market history – and sits approximately +9% higher at the midway point of the year. Coincidently, the timing, decline, and recovery were nearly a mirror image of last year’s Tariff Tantrum.
In both scenarios, we wrote about staying measured through the news flow and monitoring how much selling had already been done. In both instances, our preferred measure of market sentiment & positioning – CNN’s Fear & Greed Index – registered a sub-10 (out of 100) Extreme Fear reading which gave us confidence a bottom was near, and ultimately, proved correct.
Year-to-date, semiconductor stocks have been the best performing asset class returning a whopping +82%. As the AI infrastructure buildout continues full speed ahead, memory and chips are the bottleneck in this process. Micron (MU), for example, continues to echo extremely tight supply amongst extremely high AI related chip demand. In fact, they are even expecting this to continue into 2027, quite the backlog. Historically, semiconductor stocks tended to trade with a low multiple, meaning the market would not expect them to continue to grow at high rates forever as demand for chips tends to be cyclical, or highly correlated with general economic growth. This would tend to put a ceiling on these stocks. Now, however, they are being seen structural winners in that the AI buildout will continue for many years into the future, requiring a new perpetually high level of demand for their chips. This is likely partially true, but any slowdown in the budget for this buildout (primarily funded by the Big Tech companies such as Amazon, Google, and Meta) likely will still cause dramatic price swings to the downside. We will address this in more detail later.
On the flip side, anything that tends to trade relative to interest rates and/or the US Dollar has struggled this year. At the start of the year, the yield on the 10-Year US Treasury was approximately 4.18%. As inflation expectations rose during the conflict with Iran, this caused the 10-Year US Treasury yield to rise as high as 4.67% before settling around 4.42% today. We know there is an inverse mathematical relationship between interest rates and bond prices, so as interest rates have risen, bond prices have declined with the average bond down approximately -1% this year.
The US Dollar – as measured by its relative strength to other currencies, particularly the Euro – has appreciated +5% this year. Since commodities are priced in Dollars, this creates a headwind to their price which has resulted in precious metals declining substantially from their highs earlier this year. Gold is officially in a bear market as it has declined over -25% from its peak and silver has lost approximately half of its value from its late January highs. The only asset performing worse than silver year-to-date is Bitcoin, which has lost about a third of its value.

Weekend ‘War’
The ongoing conflict with Iran has certainly driven headlines and thus stock prices for the last several months. In no surprise to anyone, President Trump began touting ‘deal’ headlines once the stock market selloff became statistically significant. Of course, market participants did not know where that level lie in real time, but in hindsight, it was after the S&P 500 entered a technical correction of approximately -10% YTD. Since then, there have been numerous fits and starts to any sort of real deal with Iran. What we do know is that anytime the stock market teeters, more deal headlines hit the tape.
Most recently, were the events that unfolded last weekend. The stock market was showing significant weakness last week and heading into the weekend where the S&P 500 had breached the 50 day moving average to the downside, a key technical level that suggests a short-term uptrend is over. After the market closed on Friday, an Iranian drone/projectile struck a commercial cargo ship in the Strait of Hormuz, which the US and Trump called a ceasefire violation of the recent US-Iran memorandum of understanding (MoU). The US responded with airstrikes on multiple Iranian military targets and Iran responded in-kind with missile/drone attacks on US-linked targets in Kuwait and Bahrain. The US retaliated yet again. It seemed all but certain that the stock market would open significantly lower on Monday (the 29th). Then, just one hour before stock market futures began trading Sunday evening, Trump and US officials signaled de-escalation that the US and Iran agreed to halt further attacks and resume talks (reported in Doha, Qatar on or around June 30). The S&P 500 rallied more than +1.5% on Monday while the Nasdaq rallied +2.5%. The rally continued the last day of the month/ quarter.
This tit-for-tat approach and Trump conducting strikes outside of stock market hours, particularly on the weekend, will likely continue. It would appear managing a war based on the stock market’s response to be poor foreign policy, but perhaps this at least allows for a mitigation of drastic escalation which we can probably all agree is a good thing. Regardless, we expect these events and headlines to continue to add to short-term volatility. Objectively, as of now, cargo/tanker traffic has resumed to about two-thirds of the prior volumes. This is positive and it has caused crude oil to decline approximately -38% from the peak scare price of $115/barrel in April to just about its pre-war level of $70/barrel (see crude oil futures price below). We will continue to mange the ongoing conflict in context of market sentiment & positioning rather than to short-term headlines.

A New Paradigm at the Federal Reserve
In our February Market Update, we wrote about how:
“Trump shocked financial markets on January 30th when he announced that Kevin Warsh would succeed Jerome Powell as Chairman of the Federal Reserve. This was shocking in that Warsh is seen as a policy ‘hawk,’ meaning, his stance is to be tight or less accommodative in his monetary policy (i.e prefers higher rates over lower rates etc.). His appointment was confounding as Trump has repeatedly and publicly berated Jerome Powell to cut interest rates and yet he appointed someone who has said: the fed waited too long to raise interest rates in 2022, lost credibility by overstimulating post-COVID, and believes quantitative easing (aka money printing) inflates asset bubbles and wants a smaller Fed balance sheet while focusing on controlling inflation. While on principle we would agree with these statements, in that the Fed has been far too easy in their monetary policy approach generally, it is a phase shift to something much less accommodative and not what Trump has been communicating.”
On June 17th, Kevin Warsh hosted his first FOMC press conference where he underscored this new era of Fed policy. There were several key takeaways:
- The Fed held policy rates steady at 3.5%-3.75%, as the market expected, but the ‘dot plot,’ which is a summary forecast of the other FOMC members, pointed to a possible rate hike later in 2026. This is hawkish.
- Chairman Warsh did not submit his own ‘dot,’ consistent with his long-time criticism of forward guidance. Recall, Fed Chair Alan Greenspan initiated ‘forward guidance’ right before the Tech Bubble burst in early 2000 and this was continued and amplified by Fed Chair Ben Bernanke amid the Great Financial Crisis. The idea of forward guidance is that the Chairman would be overly communicative in their opinion on where interest rate policy was headed. Warsh believes this actually causes too much noise and would rather the incoming economic data speak for itself. We agree this is a more objective approach as the market can react solely to data released in real time and not have to guess as much about how the Fed might respond. While positive on principle, it will likely lead to near-term uncertainty as the market gets used to this approach.
- He stated the Fed has ‘missed’ on inflation for years and vowed to deliver the 2% target unambiguously. He suggested more focus on the inflation risk portion of the Fed’s Dual-Mandate versus labor market softness. As we stated above, we agree the Fed has been far too easy in the monetary approach generally which has led to higher than target inflation. Moreover, he suggested he is willing to tighten rates to tame inflation at the expense of the labor market. This is also hawkish.
- Lastly, he announced five new task forces to rethink core Fed operations with results expected by the end of the year. Areas of focus are: Fed communications strategy, balance sheet policy, data sources and reliance (he criticized current data as ‘old-fashioned’), productivity/jobs/and economic transformation, and inflation framework and assessment. Here, we did not receive much more information. Rethinking the approach and philosophy on these subjects is likely appropriate, but there exists a lot of uncertainty on whether this will result in more dovish or hawkish policy.
In summation, Chairman Warsh’s first press conference was consistent with his prior statements. It was, on net, hawkish as well as uncertain, both of which the stock market does not like. The stock market had been week after this press conference but was then saved yet again by another Trump ceasefire. At some point – and perhaps soon – the stock market will likely revert to trading more on this hawkish and uncertain Fed rather than on ceasefire headlines.
The Boogeyman: Inflation
Prior to Chairman Warsh’s first press conference, we received the most recent May Consumer Price Index (CPI) and Producer Price Index (PPI). CPI is an attempt to measure the inflation borne by the consumer, while PPI is an attempt to measure the inflation borne by producers or at the wholesale level. PPI typically tends to be higher than CPI as it is more reflective of real time price increases in commodities.
As you can see in the first chart below, CPI came in at +4.2% (year-over-year % growth), the highest reading in over three years. Similarly, PPI (second chart) came in at a whopping +6.4%, skewed much higher by energy prices in May. It is interesting to note that this has been on the rise since the start of the year, most notably, even before the Iran War began in early March. Chairman Warsh was keenly aware of this data when he took the podium so his tough comments on inflation were appropriate.


About a week after his press conference, we received the May Personal Consumption Expenditure (PCE) data (chart below), yet another read on inflation and is the Fed’s preferred inflation gauge, probably because it tends to always come in the lightest due to its composition. When the Fed says they target 2% inflation, this is the metric they cite. The most recent reading was similarly the highest in over three years, and interestingly, PCE Excluding Food & Energy was +3.4%, higher than April. This is the 63rd consecutive month above the Fed’s 2% target. Objectively, this is where former Chairman Powell failed and where Chairman Warsh is tightening the reigns. Of course, oil prices have retraced all their Iran War gains since the end of May as mentioned above, but this tells us there is still consistently growing inflation pressure even outside of the prior run up in energy costs.

Last Thursday Apple announced price increases on several MacBooks and iPads by roughly 20% or hundreds of dollars. This early morning announcement caused the Nasdaq to sharply decline -2% at the open. Apple cited soaring memory/storage chip prices due to AI data center demand and that they could no longer absorb the costs as they had ‘never seen a component price increase this much, this quickly.’ Later in the day, Microsoft announced they raised Xbox prices by $100-150 and was the third Xbox price increase in about a year. They cited the same memory/storage shortage that costs have increased more than 2.5x and are expected to double again by fall 2027. This is rather groundbreaking news as AI has always been thought of as ‘deflationary’ in that this technological advancement would contribute to lower prices, not higher. In this most recent development, we are now witnessing what some are calling ‘AI-flation’ which is now yet another contributing inflationary force. Clearly, yet another reason Chairman Warsh is likely to be hawkish and favor future interest rate hikes (bearish for stocks and precious metals).
Lastly, as the Kobeissi Letter points out, “the gap between the US unemployment rate and headline CPI has narrowed to just 0.1 percentage points, the smallest since 2022 (chart below). This comes as inflation, by all measures, rose to its highest levels in three years. Historically, periods when this gap has approached zero have often been followed by Fed rate hikes. The most recent example includes 2021-2022, when inflation exceeded the unemployment rate for 22 months. This prompted the Fed to hike rates by 5.25 percentage points to 5.5% between March 2022 and July 2023, the highest since 2001.”
If the market’s attention shifts back to inflation, you can expect us to increase our positioning in the ‘managed futures’ alternative investments like we did in 2022. In fact, we have already been slowly increasing our allocation to this bucket over the last several months, as these tend to perform well in periods of rising interest rates and/or weaker stock markets.

Precious Metals Deep in a Bear Market
Long time readers of our commentary know we have greatly favored precious metals, particularly gold. The simple thesis is: buy gold to protect purchasing power as the US government continues to spend trillions more than they receive in tax revenue (i.e. $2 trillion+ annual deficits) while the Federal Reserve prints money out of thin air to purchase the debt that foreigners no longer buy. This is still the case, and yet, gold is down -25% from its late January high, silver has been cut in half, and gold and silver mining stocks are both down around -35% from their March high. Coincidently, inflation is also back up, so why are precious metals deep in a bear market? Let us review our commentary from our late March Market Update:
“While many think of gold as an inflation hedge, and it is (over longer periods of time), it is more of a hedge on the central bank’s ability (or inability) to manage inflation. Said another way, as inflation expectations increased, the market priced out Fed rate cuts and might even be pricing in some rate hikes to deal with this reemergence of inflation. So, in the short term, the market is assuming the Fed will enact tighter monetary policy to combat inflation.
We see this market logic as accurate, in the short term. Certainly, the market previously thought the Fed would cut rates and now the expectation is that the Fed will not cut at all. As assets are priced on the margin, this is short-term bearish for precious metals. If the Iran conflict becomes protracted and oil prices continue to climb, the market will assume the Fed will be forced to raise interest rates to combat inflation. This is a possibility and bearish for stocks and precious metals. As such, we greatly reduced our positioning in precious metals and mining stocks.”
We still hold this viewpoint. As Chairman Warsh is focused on inflation and the incoming data has only confirmed more inflation, the market continues to sell-off precious metals. This is despite the longer-term thesis still being valid. In fact, we would argue, the Fed does not have much room to increase interest rates without blowing up the economy, the stock market, and/or the bond market. So, we continue to hold our long-term position in gold but do not hold any additional precious metal exposure like we did last year or on a couple of brief instances this year.
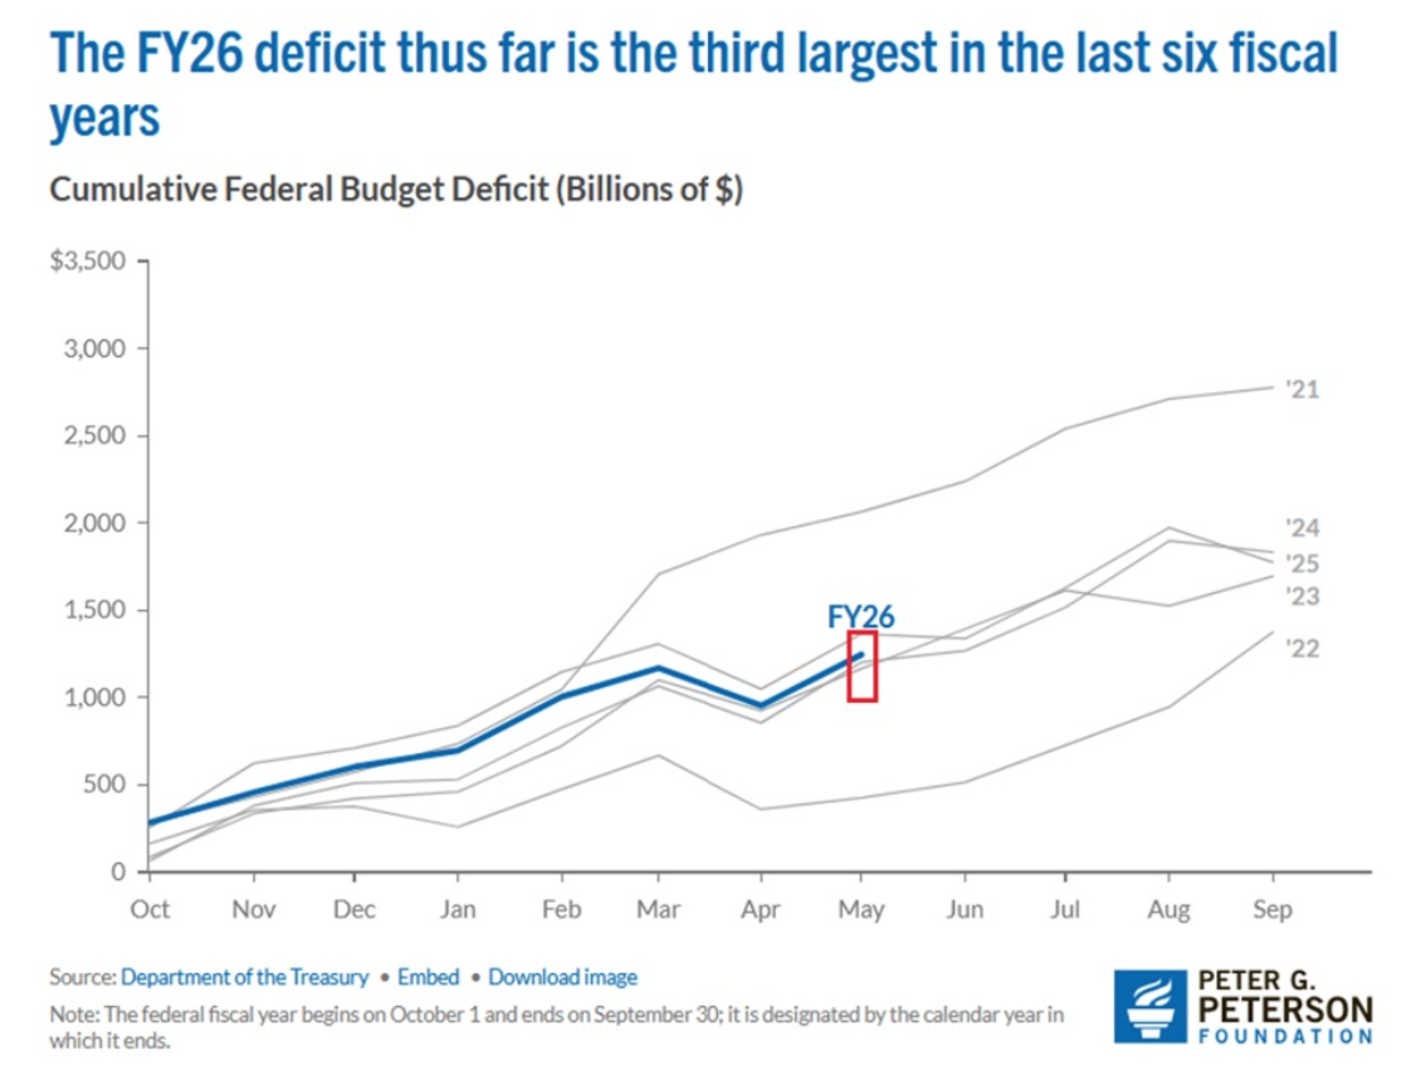
At some point, the market will refocus on the long-term thesis of deficit spending to no end and ever-increasing national debt, once the noise around Fed rate hikes subsides. As seen in the chart below, in the first 8 months of fiscal 2026, the US deficit hit $1.25 trillion, the 3rd-highest in history. Over the same period, net interest expense rose to a record $723 billion, on pace for over $1 trillion this fiscal year, making it the second largest government expenditure after Social Security. Keep in mind that during the infamous 1970s inflationary decade and corresponding gold and commodity bull run, gold and silver both suffered a nearly -50% drawdown in the mid-1970s, only to resume higher. At the time, inflation eased after the initial oil shock in 1973. Also, there was a brief rebound in confidence in fiat currencies. As they say, history often rhymes, and this sounds eerily similar to today as the market expects the Fed to raise rates to quell this re-emergence of inflation while the Dollar (as measured by the DXY) has strengthened +5% this year. We think bitcoin is also suffering because of this logic. Precious metals will have their day yet again.
The AI Show Goes On
As we mentioned at the beginning of our commentary, semiconductors have been the major beneficiary of the AI trade, leading stock market returns for the year. Their gains have been so impressive that the sector now makes up almost 20% of the S&P 500’s total value (as measured by market capitalization), which has tripled since the 2022 bear market. Not only have semiconductor stocks exploded, but it has been at the expense of the so called ‘Magnificent 7,’ or the Big Tech companies (Apple, Amazon, Alphabet, Meta, Microsoft, Nvidia, and Tesla), that have carried stock market performance over the last 10+ years. The logic has been, buy the beneficiaries of the AI infrastructure buildout (demand for chips), not the companies that are paying for it (Mag 7). As you can see in the chart below, the semiconductor ETFs (SOXX and SMH at the top) are up well over +80% this year while the ETF that tracks the Magnificent 7 (MAGS) is actually down YTD and has even recently retraced most of its gains from the Iran War lows in April.

As we also discussed in our February Market Update:
“Big Tech spending, which was previously lauded as driving revenue for data center buildouts and demand for semiconductors, is now being viewed as a highly uncertain return on investment. Specifically, the Magnificent 7 is forecasted to generate almost $1 trillion of cash flow from operations this year. Their planned capital expenditures (capex) towards AI for 2026 is almost $700 billion, a staggering sum, but profitability remains uncertain in the near term. Investors are questioning whether this spending will yield quick returns or just inflate costs. This has led to a ‘sell first, ask questions later’ mentality, with the market selling AI-exposed firms before fundamentals fully reflect the impact.
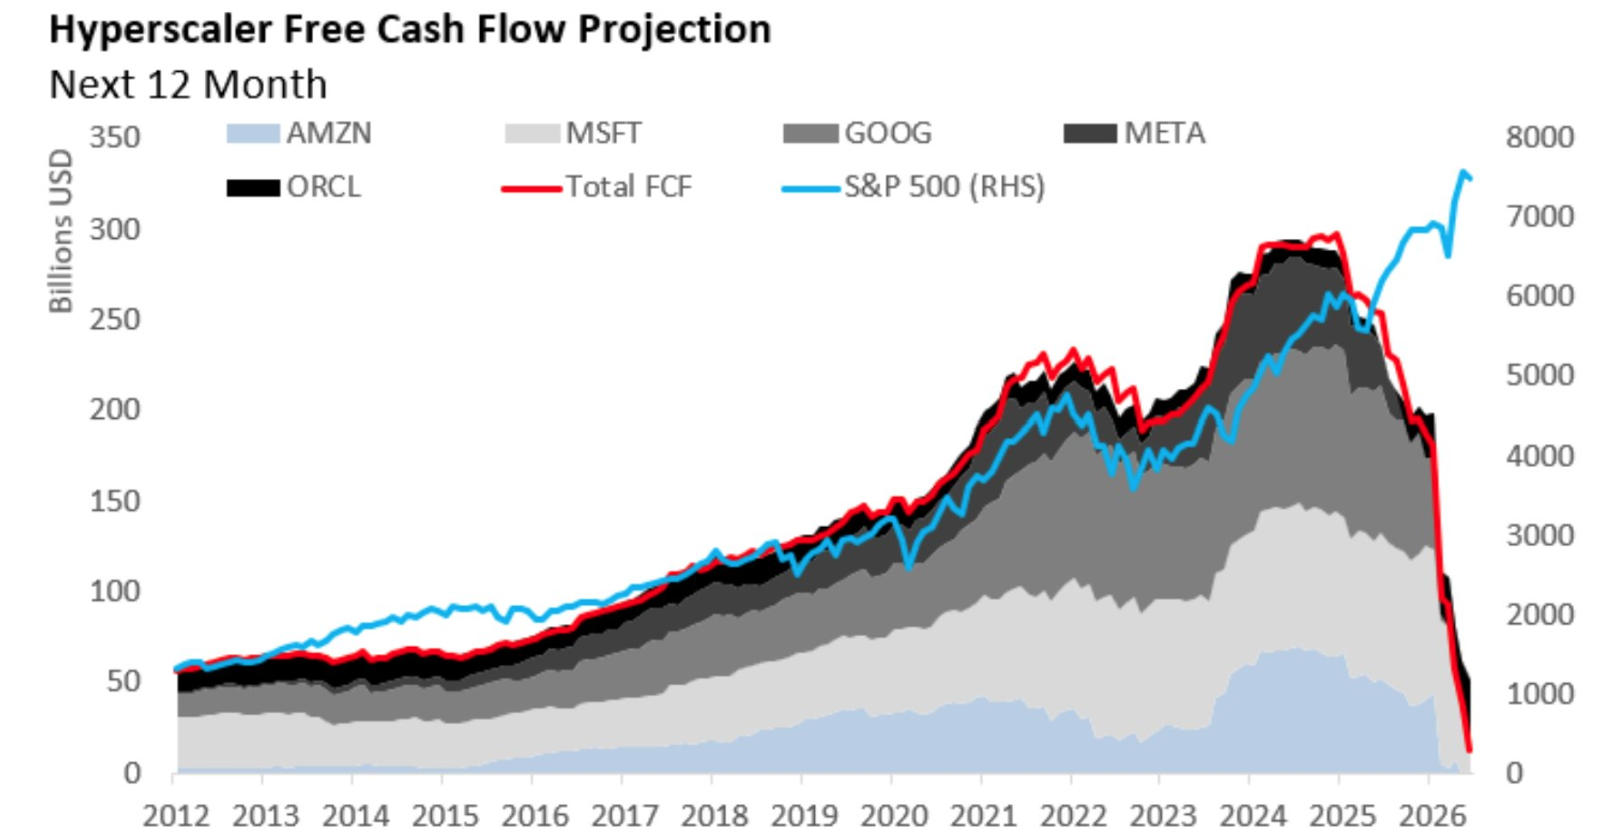
Furthermore, these companies’ free cash flow – which represents how much cash they have left from operations less capex – will be down approximately -25% from 2025. For instance, Amazon is forecasted to generate $180 billion of cash this year and they have guided Wall Street analysts to spending $200 billion on capex (i.e. AI related buildout costs). This indicates they will be free cash flow negative to the tune of $20 billion (vs positive $11 billion last year). Wall Street and stock investors like to see positive and growing free cash flow. It projects strength and is a sort of margin of safety. It also allows companies optionality such as buying back their own stock, which helps to add some degree of a ‘floor’ to the stock price. In this case, Amazon has not bought back a single share of their own stock since Q2 2022. As the Kobeissi Letter points out, Meta slashed share repurchases to $3.3 billion in the second half of 2025, down from $33.5 billion in 2021. Alphabet (Google) cut buybacks to $17 billion, nearly half of the $30.6 billion spent in 2024. Combined buybacks by Amazon, Alphabet, Microsoft, Meta, and Oracle plunged to $12.6 billion in 2025, the lowest since Q1 2018.”
You can see in the chart below that the free cash flow of these companies grew for over 10+ years and now they are reinvesting all of it into the AI buildout. We think that at some point, when the Big Tech companies deem their stock prices too weak, we will see a reversal of this trade. Meaning, Big Tech will cut their spending and their stocks will revert higher at the expense of semiconductors. Of course, it is hard to predict when this might play out so we think owning both is the prudent move for now and we can adjust as needed in the future.
Second Half 2026 Outlook
We expect volatility to continue in the broad stock market indices as well as between sectors and asset classes. The conflict in Iran will continue to give us both bullish and bearish short-term headlines. The new regime at the Federal Reserve will likely create pressure on stocks and precious metals through some tough talk on interest rates. The AI trade will likely power forward with both winners and losers. Mid-terms are also on the horizon, which has historically been a tough period leading up to voting, but then historically strong on the other side. Wall Street forecasts S&P 500 companies will grow earnings 15-25% this year marking multiple consecutive years of double-digit growth for the index. Our strategy remains to not overreact to news headlines and monitor market sentiment & positioning, while picking spots that are beneficiaries of the trends we discussed.