Blog
October 2025 Market Update: There’s Gold in Them Thar Hills

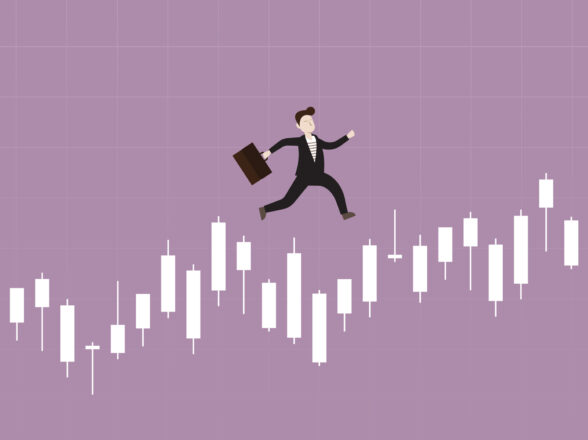
What a difference a couple quarters can make. It was a six short months ago that it seemed the markets were headed for disaster. Many investors were pulling money out of their risk investments, like stocks, in favor of the perceived safety of cold, hard cash. Some investors were convinced that, with the S&P 500 down about -18% for the year, that there was nothing but more losses to come given the perceived ill-effects of tariffs the likes of which the world has never seen. It struck us as quite curious the number of clients who were closet experts on international trade and economics that we, heretofore, had been unaware of!
Yet, something was starting to shift in the indicators that we watch that give us confidence in the future direction of markets.
What can make successful investing so difficult sometimes is that we must fight our instincts in order to get it right. Studies show that Negativity Bias is real, and can lead us to bad decisions when it comes to portfolio management because we humans tend to dwell on the negative. The news – and our sources of news – clearly play into this phenomenon, and not is a good way.
Here at Infinium, we are hyper-focused on your success, and have never had a better grasp on what is driving the markets today. Since we are an active investment manager, our cash-levels were already higher than normal going into April (approximately 20-30% of portfolios), and we used that once-in-a-generation buying opportunity to acquire high-quality investments on the cheap. In essence, we stuck gold at a time when far too many investors had overreacted to the perceived negative news flow.
If you find yourself overly concerned with the political environment today, we offer encouragement to not let your views there influence what we are doing for you here in your portfolio. The market action this spring proved once again that the most upset investors, who where the most active in wanting to get more conservative into April, are now the worst performing accounts in our practice. This is not a title you want to win!
Market Highlights
2025 has been a record on just about every metric. Since the April lows, the index has since notched 30 daily closes above new all-time highs. 23 of those have occurred in Q3, tying the most for any quarter since 1998. September posted its 14th-strongest monthly rally since 1950. The tech-heavy Nasdaq is now up for 6 straight months, for the 6th time since 1986. As the Kobeissi Letter notes, in the previous 5 instances, the Nasdaq never ended lower 12 months later, with an average gain of +18%. If history is any guide, that would imply another 9% rally into year-end. Below is a snapshot of year-to-date asset returns through the third quarter.
Year-to-date returns through September 30:
- Dow Jones: +8.9%
- S&P 500: +12.8%
- Nasdaq: +16.4%
- Russell 2000 (Small-cap): +9.6%
- 60% Stocks/40% Bonds(AOR): +12.3%
- 10 Year US Treasury Bond: +3.3%
- 20 Year US Treasury Bond: +1.8%
- US Dollar (DXY): -10%
- Crude Oil: -12.1%
- Gold: +47.7%
- Silver: +62.5%
- Bitcoin: +24.6%
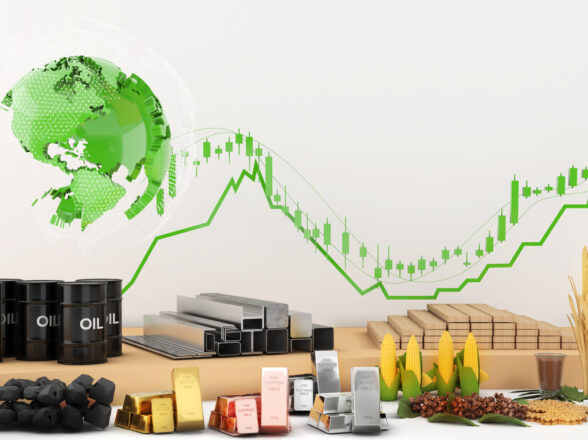
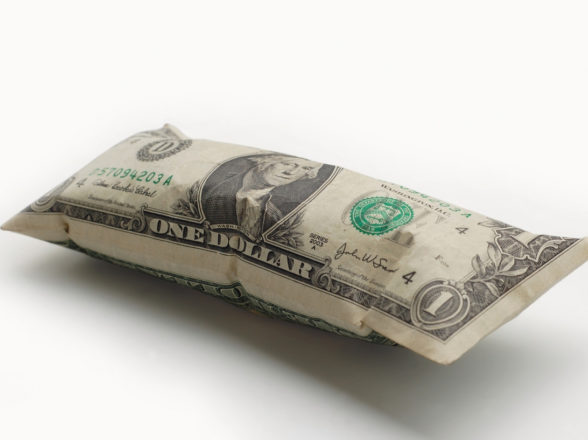
Of course, the real story has been in the precious metals. At the time of this writing, gold is currently trading just above the $4,000/ ounce level having appreciated approximately 50% YTD. In September, gold surpassed its inflation adjusted all time high from the 1980s (meaning, after adjusting the 1980s gold price higher for the cumulative inflation we have witnessed over the last 40-50 years, today’s price is now even higher than that previous inflation adjusted all-time-high). Silver has even bested gold, up over 60% YTD currently sitting at approximately $48.50/ ounce, just shy of its 2011 all-time high. If gold’s previous breakout to new all-time highs can serve as any guide, silver could still trade considerably higher.
Clients and long-time readers of our updates know we have been writing ad nauseum about the opportunity in precious metals for well over 12 months. Inflation and ‘fiscal dominance’ (aka the US government needs to cut rates in order to more cheaply service the interest on its ever-increasing debt) has propelled asset prices higher – particularly precious metals – at the expense of US Treasury Bonds (+2-3% YTD) and the US Dollar (-10% YTD). This is exactly what has occurred and continues to occur. If you are heavily invested in cash and bonds and underinvested in precious metals, you are being left behind as fiat currency withers away.
Starting in May, we upsized our positioning in precious metals as silver and gold & silver miners went on a 40-50%+ move higher in the last several months. Given our structure as a registered investment advisor (RIA), we were able to make these material positions and take advantage of this opportunity; many/most investment advisors would be unable to do this in any meaningful way. In the 16 years Infinium has been in business, we too, along with stocks and precious metals, are having a record year.
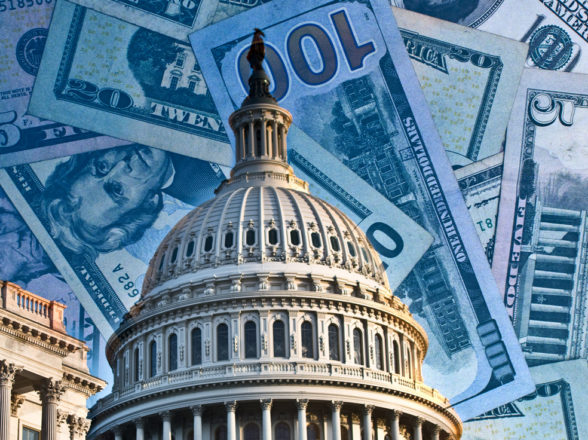
Government Shutdown
There has been much ado in the last week or two about the government failing to pass a continuing resolution to keep the government open. In short, the two parties must agree on how much to raise the debt ceiling, meaning how much more they will spend (also bullish assets, especially precious metals). We are completely agnostic on this situation from an investment point of view and hold no opinion on the political infighting. What we do know is the following (compliments of Carson Investment Research): since 1976 there have been approximately 20 shutdowns ranging from 1 to 34 days. The S&P 500 advanced higher 55% of the time with an average return of +0.3%. 12 months after the shutdown, the market was higher 86% of the time with an average return of +12.7%.
Interestingly, the last shutdown was also the longest and also under President Trump. In December 2018, the government was shutdown for 34 days and returned a whopping +10.3% over this roughly month-long period. Furthermore, the Federal Reserve raised rates for the last time in December 2018 (after having raised 4 times that year) and opened the door to interest rate cuts in 2019 (where they ended up cutting 3 times). This sounds quite familiar to the current situation as Jerome Powell just cut interest rates for the first time in a year.
Point being, there is little to no reason to factor the government shutdown into your investment thesis. In fact, it is historically statistically bullish. Since this shutdown was known to be likely on September 29th, the S&P 500 has rallied approximately +1.5%. History has thus far served as a guide.

Can Stocks Rally from Here
As noted, the stock market is at all-time highs and has set numerous records on its way to today’s latest record close. It is important to note that while the S&P 500 has rallied 35% from the March lows, the full year return including its -20% drop, stands at approximately +15%. In the 8 years since 2017, the S&P 500 has appreciated >20% in 5 of those years, or almost 2/3rds of the time. Similarly, but over the last ~100 years, in the years the market is positive, the average annual return is approximately +19%.
Often you hear that ‘the stock market is expensive.’ There are numerous ways to measure this but P/E multiples, or Price-to-Earnings multiples, are a highly cited metric. Simply put, this refers to how much you are paying for a stock’s (or the market as a whole’s) earnings. For example, if you bought 1 share of Apple at today’s price of $256 per share, you would be paying 39x its last twelve month’s earnings per share of $6.56, ergo a P/E of 39x. This is historically expensive. Many more factors go into determining if this is good or bad at an individual stock level, but this is how it is calculated. Therefore, if you were to sum this metric for all 500 stocks in the S&P 500, the P/E ratio of the market today is approximately 31x. For context, the long-term average is 16x. So, by this measure alone, the entire stock market is being valued at around double its historical average. Sounds ominous, right? Well, in June 2023 that ratio was 25x, or 56% higher than the long-term average. If you sold then, you missed out on a 55% rally in the S&P 500 through today, big mistake.
Also, in the Dot-com peak, that ratio was almost 50x; therefore, the takeaway is the market can always get ‘more expensive’ and you can miss out on very significant returns if you sold based on this metric alone. The graphic below further illustrates this. The bottom line: there is no correlation between the expensiveness, or cheapness, of the stock market and how it will perform 1-year from now.

As we have continually cited, we are gearing this historic momentous rally based on sentiment and positioning. One of our primary metrics here is CNN’s Fear & Greed Index which statistically plots this data. Currently, the reading is 57 out of 100, a slight ‘Greed’ reading. This indicates that market participants are not over-extended in their positioning to reflect Extreme Greed, or exuberant behavior, an amazing data point considering the rally discussed. Therefore, we interpret this data as there is plenty of room for the market to run into year-end, consistent with some of the other statistics we previously mentioned. By contrast, if we see this metric breakdown below 50 into ‘Fear,’ we will highly likely interpret this to mean the current rally’s trend has broken down and is susceptible to downside. In the last three months, this metric has found support and bounced off 50 three times. Any number of reasons could cause a breakdown; we are watching this very closely.

The AI Bubble
The largest trend in the market, other than rate cuts & deficit spending sending nearly all assets higher, is artificial intelligence (AI). We just want to highlight two mains points here. First, in the chart below, Bank of America attempts to contextualize the magnitude of the stock market’s rally on AI enthusiasm as compared to past instances of trendy market peaks. As you can see, the current AI rally eclipses past euphoric events including the Telecom Bubble of the 90s/00s. However, all these events have been geared in some truth and this time is no different.

Since Chat GPT was released in November 2022, Big Tech earnings growth has exploded over 150% driving the S&P 500 some 70% higher. Meanwhile, the remainder of the S&P 500 has seen barely any earnings growth at all. So, AI is absolutely grounded in some truth and driving earnings, and therefore, market returns. Is it a bubble? Probably, but until we see Big Tech stocks start to miss earnings expectations, this trend is likely to continue. Lately, semiconductor companies (Nvidia, Micron, etc) which provide the necessary chips powering AI’s advance have been encouraging. Again, a close eye will be paid here and we are likely to see other metrics such as Fear & Greed breakdown confirming an issue.

Gold & Silver
The Financial Times recently shared one of the most eye-opening charts we have seen in a long time. We know that the US dollar is the world’s reserve currency. With that, central banks have long held US Treasury Bonds as a reserve ‘asset.’ As confidence in the dollar and Treasuries has continually declined due do inflation and record fiscal deficits, global central bank demand for US Treasuries has been rapidly declining. Unsurprisingly, gold has taken this market share. As of this most recent data, gold is now about to be a larger asset than US Treasuries on central bank balance sheet. We want to be positioned along side the central banks.

Silver continues to be very interesting for many reasons. Of course, it has an inflation hedge component and benefits from the declining value of the US Dollar. Additionally, it is a major input, to many of the primary trends in the economy. It is used in AI and 5G chips and components as well as parts for electric vehicles (EVs). So, it also has a demand piece, and demand is currently high in these areas. From a historical price perspective, silver is on the verge of exceeding $50/ounce, a level last seen some 14 years ago in 2011. If silver can exceed this prior all-time high, like gold did before it in late 2023, the sky is the limit. In the chart below by Topdown Charts, you can see the estimated average investor allocation to silver is less than 0.5%. If the average investor were to invest 1.5% of their assets in silver, like they did in 2011, this would be supportive of a $150/ ounce gold price, based on this metric.

For good measure, let’s briefly review why gold and silver topped out in 2011 and subsequently became out of favor.
- The dollar was strengthening post-2011 as the economy recovered from the Great Financial Crisis. Today, we know the dollar is weakening dramatically.
- There were expectations of monetary tightening as bailouts and quantitative easing were coming to end. Three weeks ago the Federal Reserve just cut interest rates for the first time in a year, aka looser monetary policy.
- Growth was slow coming out of the Global Financial Crisis and so were inflation expectations. Today, inflation is high and expectations are that it will stay high.
While the precious metals are certainly ‘hot’ and always subject to a cooling off period, the environment seems to be different this time.